Observability & logging
To observe and debug Membrane, you can use a variety of tools provided by the BEAM, like observer or Process.info. Apart from them, Membrane provides dedicated utilities for observability and logging.
Introspecting pipelines with kino_membrane
kino_membrane allows for introspecting Membrane pipelines in Livebook. You can either run the pipeline inside livebook (see example) or connect to a running VM (see example). Then, it's enough to install kino_membrane:
Mix.install([:kino_membrane])
and run
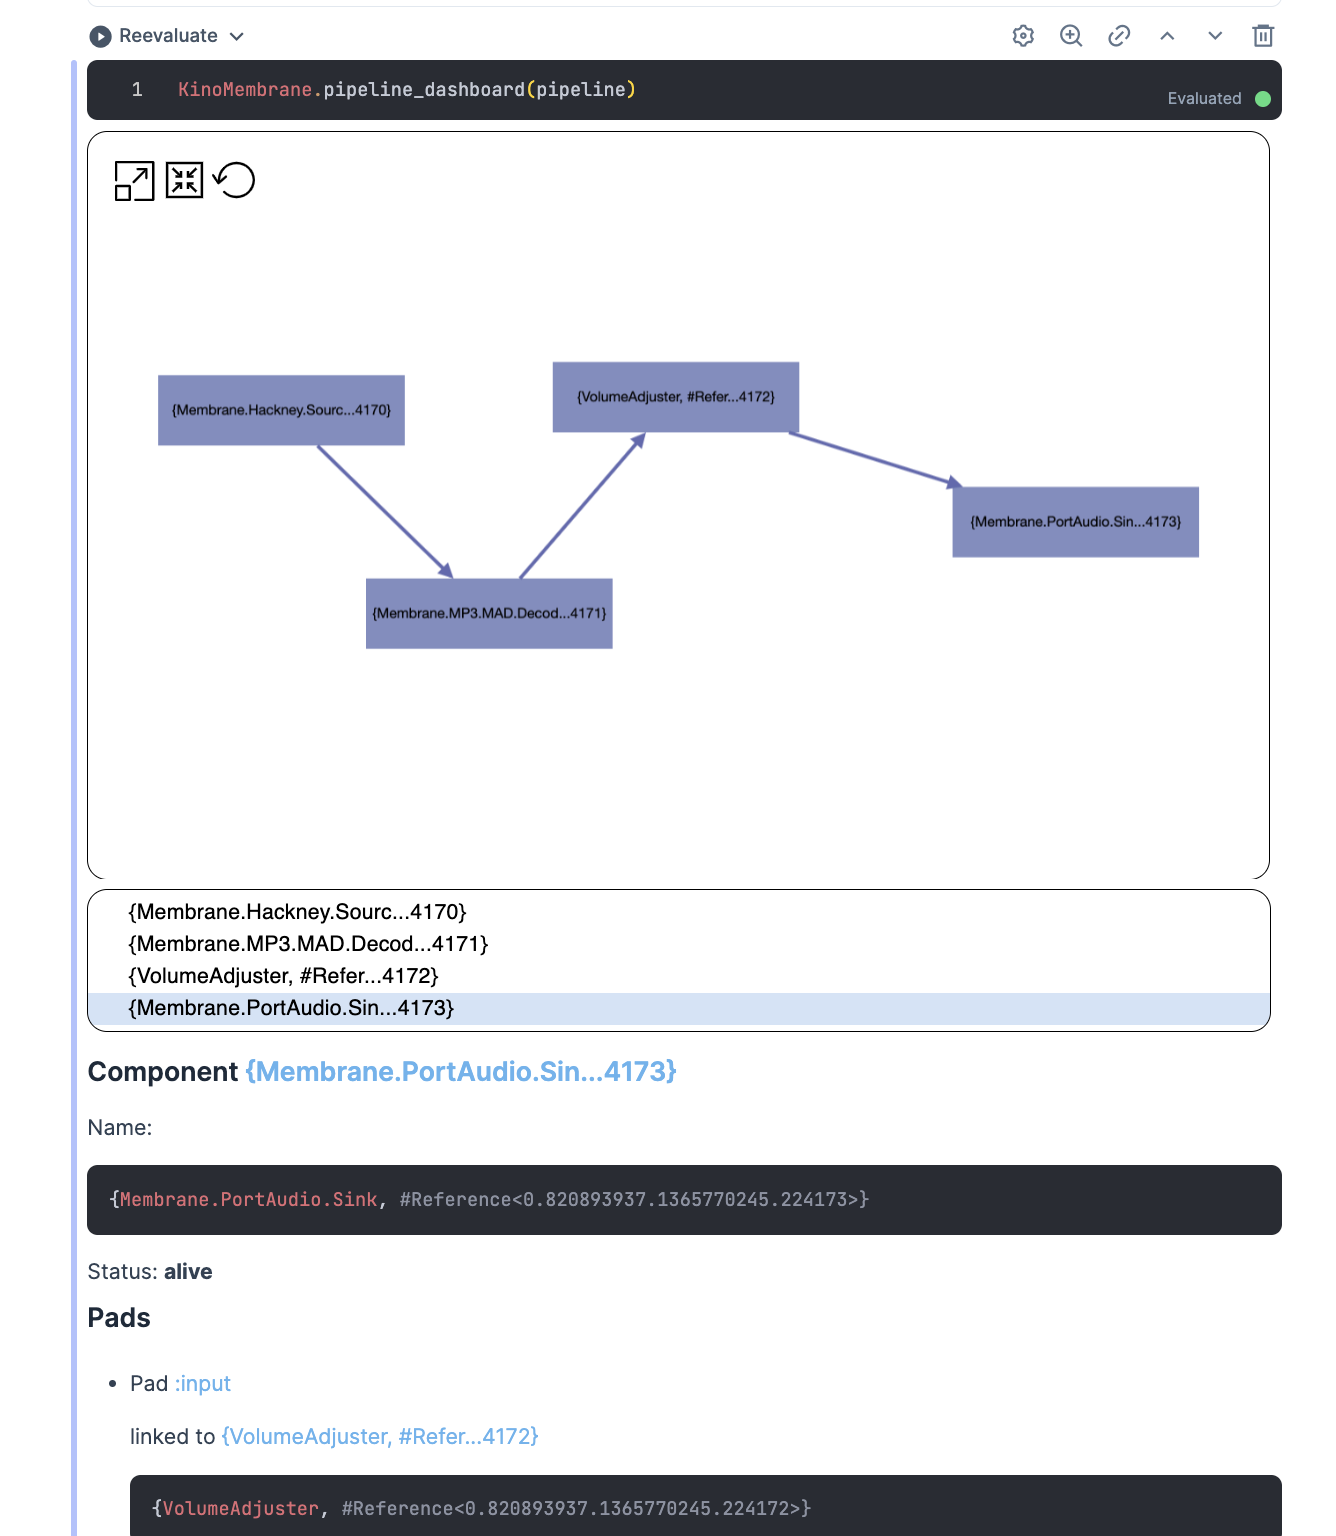
KinoMembrane.pipeline_dashboard(pipeline_pid)
in Livebook, and you'll get a panel with the pipeline graph, metrics and other utilities:
Check kino_membrane for details.
Logging
Apart from the usual Logger configuration, logging in Membrane can be additionally configured, also via Elixir's Config. It allows to enable verbose mode and customize metadata, for example:
import Config
config :membrane_core, :logger, verbose: true
For this change to take effect, it may be necessary to recompile the whole project with mix deps.compile --force && mix compile --force. See Membrane.Logger for details.
Moreover, in a pipeline or bin, you can add logger metadata to the children spec:
@impl true
def handle_init(_ctx, opts) do
  spec = {
    child(Some.Element) |> child(Some.Bin),
    log_metadata: [pipeline_id: opts.id]
  }

  {[spec: spec], state}
end
and it will add the pipeline_id metadata key to all the logs coming from Some.Element and Some.Bin and all its descendants.
To have the metadata displayed in the logs, you need to configure it as well:
import Config
config :logger, :console, metadata: [:pipeline_id]